Colors: | Black |
Capacity | 60G/120G/240G/480G |
Interface | SATAIII 6Gb/s (backwards compatible with SATA II 3Gb/s) |
Operation System | Windows® 98/98SE/ME/2000/XP/Vista™/ 7 |
Mac® OS 9.0 & Linux™ Kernel 2.4 | |
And all above versions | |
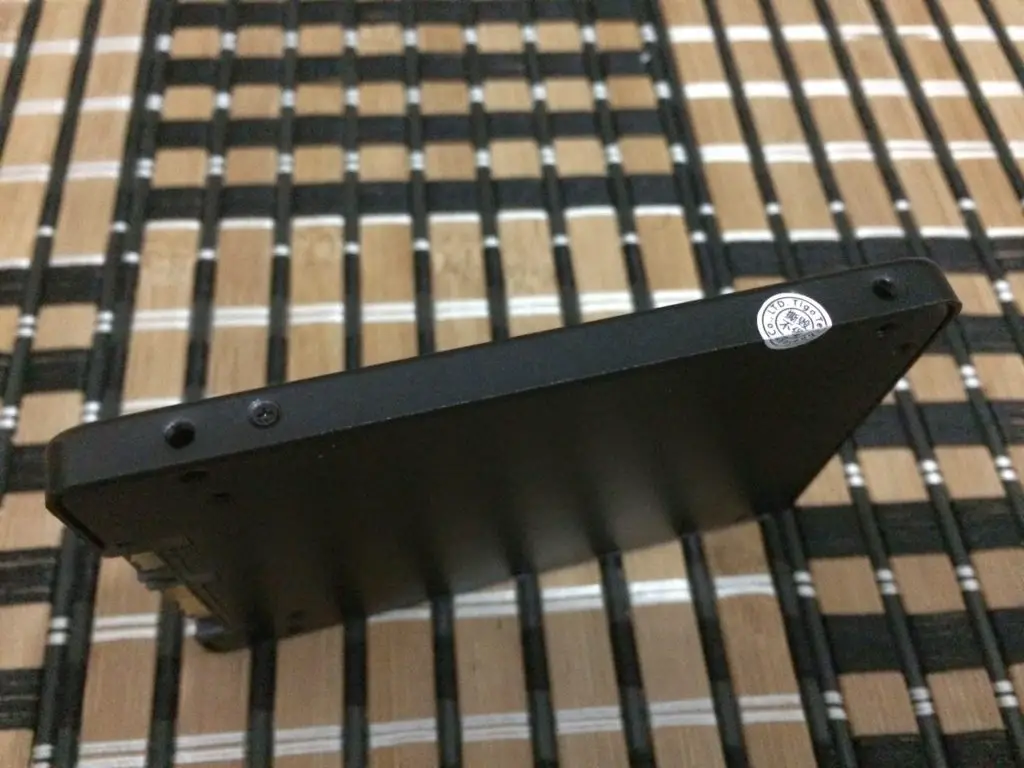
Dimensions(LxWxH) | 100×69.9×7.00mm |
Weight | 78g |
Operation Temperature | 0°C~+70°C |
StorageTemperature | -40°C~+85°C |
MTBF | 1Million hrs |
Vibration Resistance | 20G(40~2000Hz) |
Shock Resistance | 2000G/0.3ms |
Maximum Transfer Rate for Read | 480MB/s (Tested by on software ATTO Benchmark on 240GB , pls note transfer rates may vary depending on capacities and system platform ) |
Maximum Transfer Rate for Write | 275MB/s (Tested by on software ATTO Benchmark on 240GB , pls note transfer rates may vary depending on capacities and system platform ) |
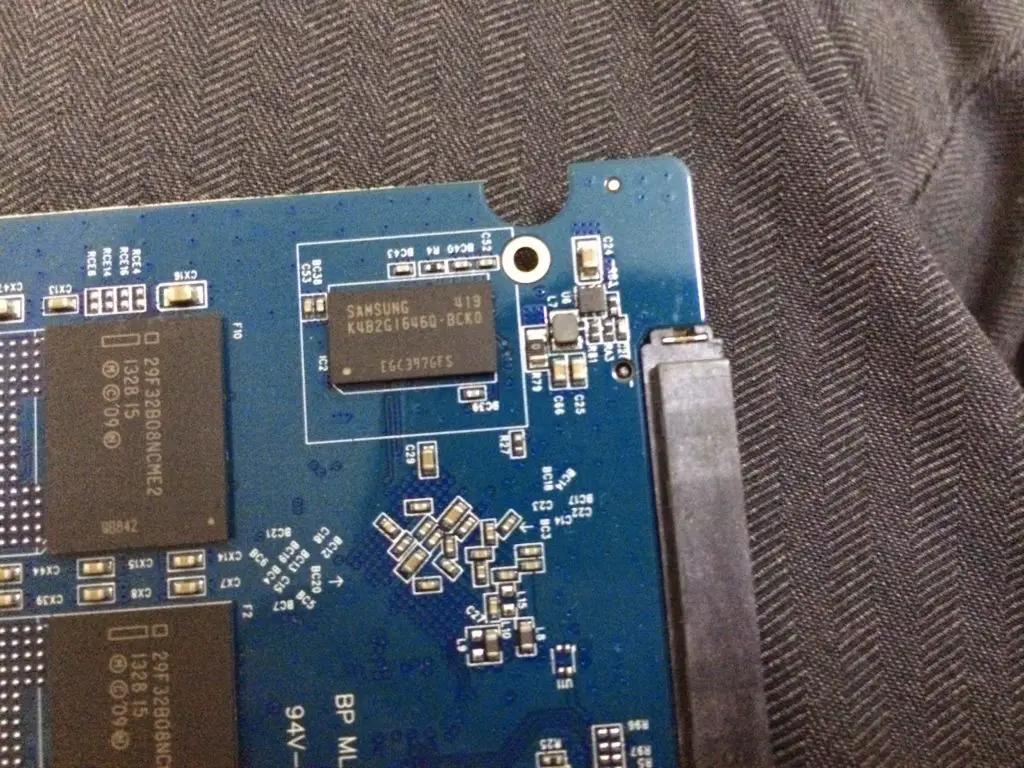
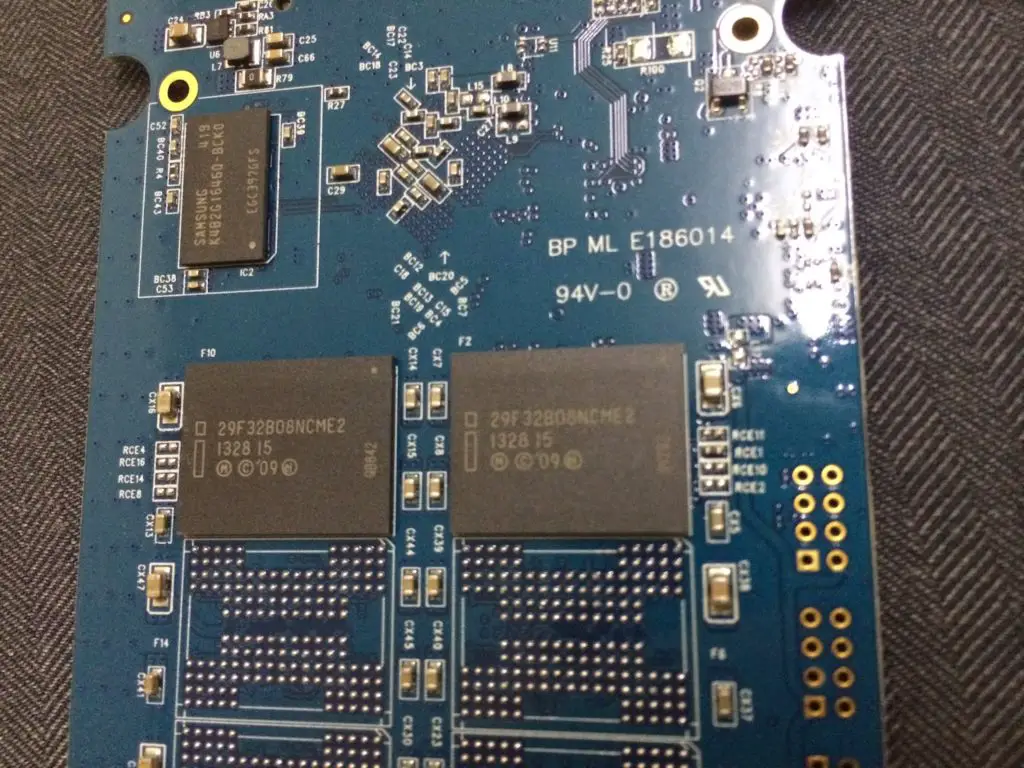
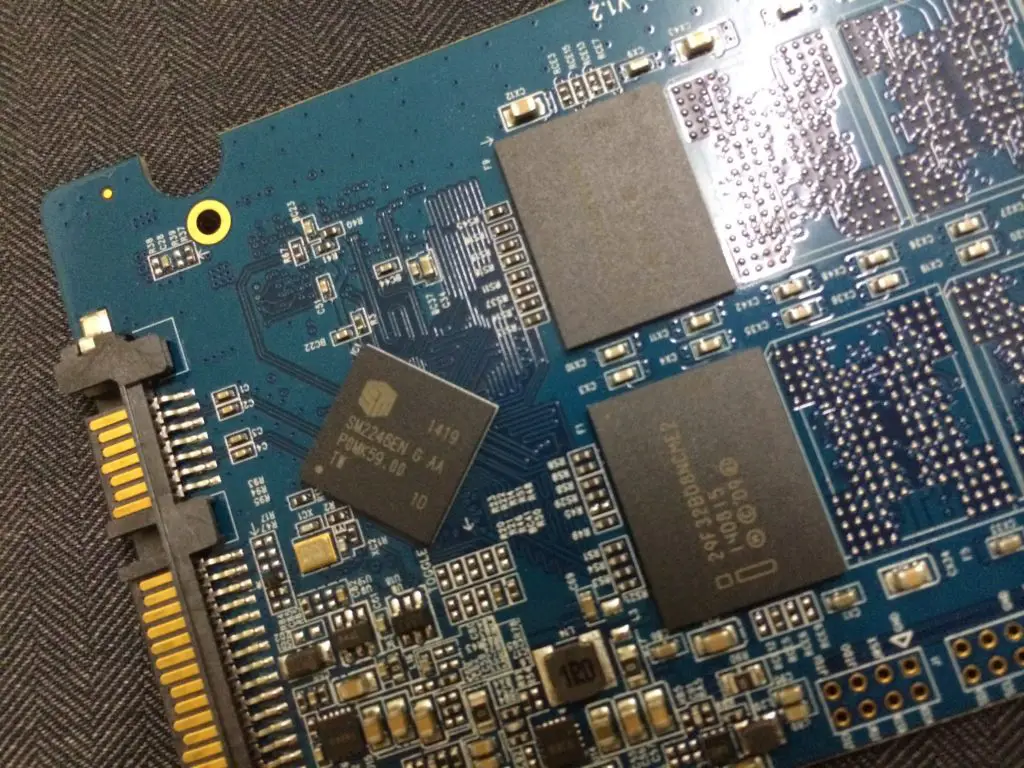
Taking a closer look we can see that the KTA-350 uses the SM2246EN SATA 6Gb/s SSD controller that features low power consumption as low as 60mW, sequential read of up to 540 Mbytes/s and sequential write up to 410 Mbytes/s, and It’s capable of up to 80,000 random read I/O operations/s (IOPS) and up to 75,000 random write IOPS.
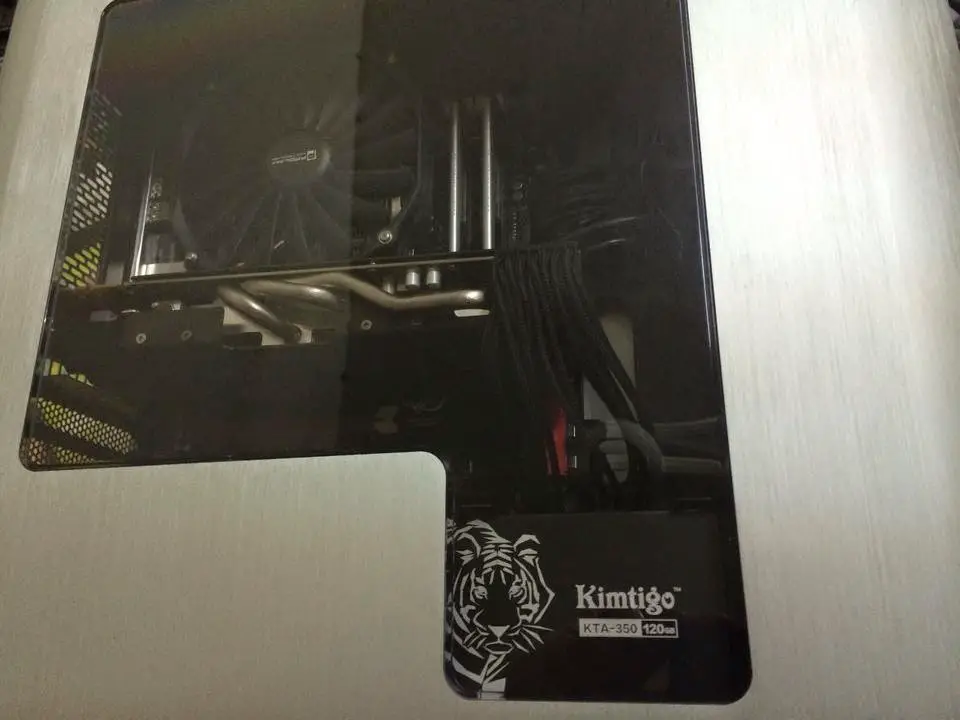
We mounted the KTA-350 on our system and here’s the result – the king tiger is ready to strike.
Testing Method
Test Rig Configuration | |
CPU Cooler | Prolimatech Samuel 17 |
CPU | Intel Core i7 4790K |
Motherboard | ASUS Maximus Gene VI |
Memory | Corsair Vengeance Pro 8GB@1600MHz |
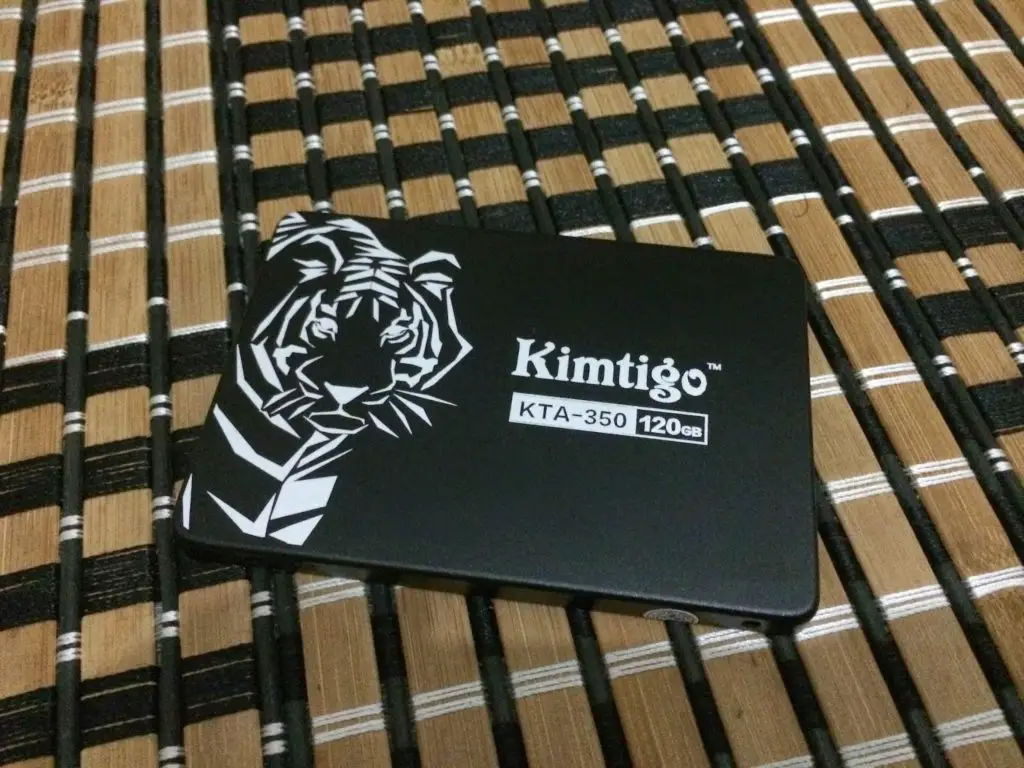
Primary Hard Drive | Kimtigo KTA-350 120GB |
Power Supply | BitFenix Fury 550G |
Chassis | BitFenix Pandora |
Synthetic Benchmarks
ATTO Disk Benchmark
The most frequently used benchmarking utility by many manufacturers for performance specification. As ATTO Disk Benchmark uses compressible data rather than compressible data, it results in higher benchmark scores. We’ve ran the benchmark with transfer size ranged from 0.5KB to 8192KB and total length of the test to be 256MB.
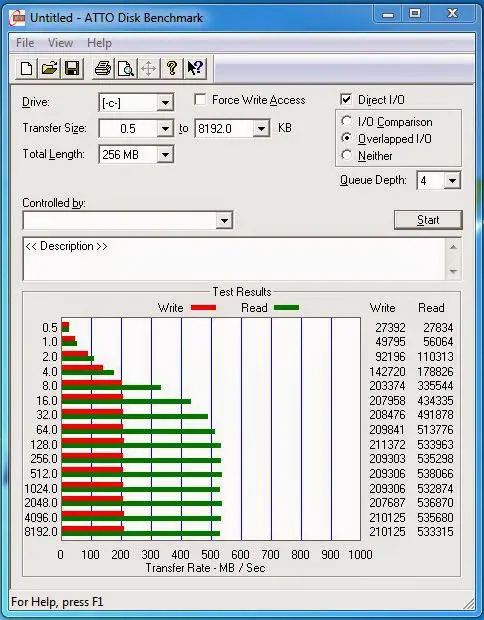
The result seems pretty good with sequential read performance peaked at 538.0MB/s and sequential write performance peaked at 211.3MB/s.
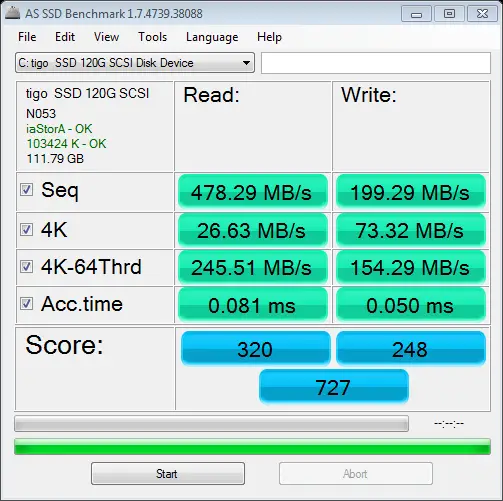
AS SSD Benchmark
Anvil’s Storage Utilities
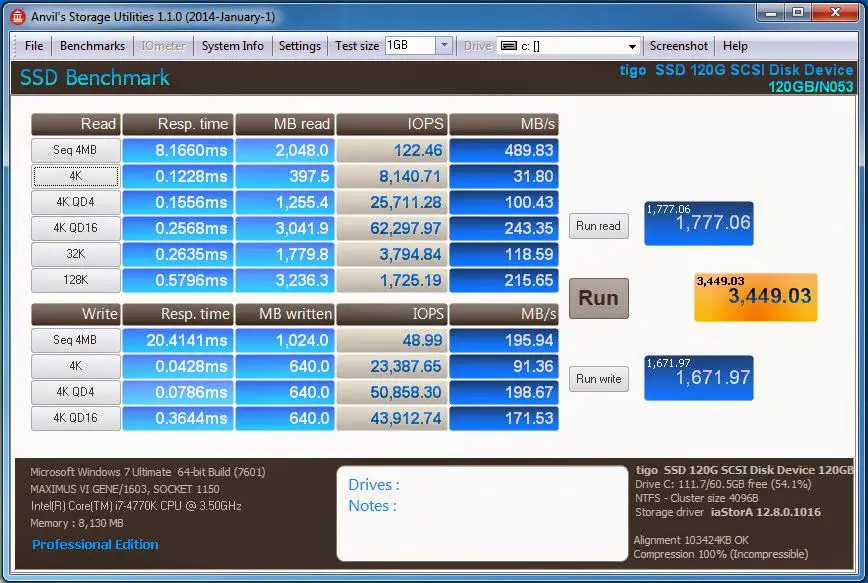
While both sequential read and sequential write performance exhibits the near result as what we’ve seen in AS SSD benchmark, we can see the SSD’s response time that is not displayed in majority of the SSD Benchmarking utilities out there.
CrystalDiskMark
Developed by a Japanese coder that goes by the nickname Hiyohiyo, CrystalDiskMark is one of the most frequent used SSD Benchmark utility to measure SSD’s read and write performance. There’s 2 option for the test data used, compressible (0 fill) and incompressible (1 fill).
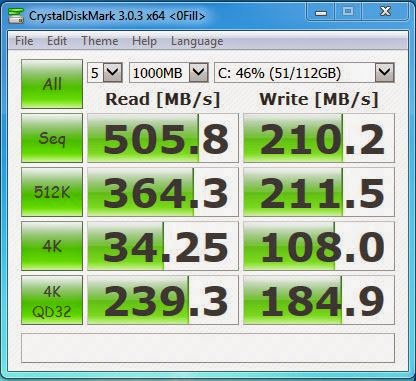
We’ve selected 1 fill as our test data and the result isn’t bad either. The result shows a better result than both AS SSD benchmark and Anvil’s Storage Utilities, with sequential read performance peaked at 505.8MB/s and sequential write performance peaked at 210.2MB/s. Both 4K read and write performance seems pretty decent, with 34.25MB/s for 4K read and 108.0MB/s for 4K write.
Real World Performance
We’ve ran several test that with several SSD (including the KTA-350) with at least 40% capacity occupied with various commonly used software to simulate the real world scenario.
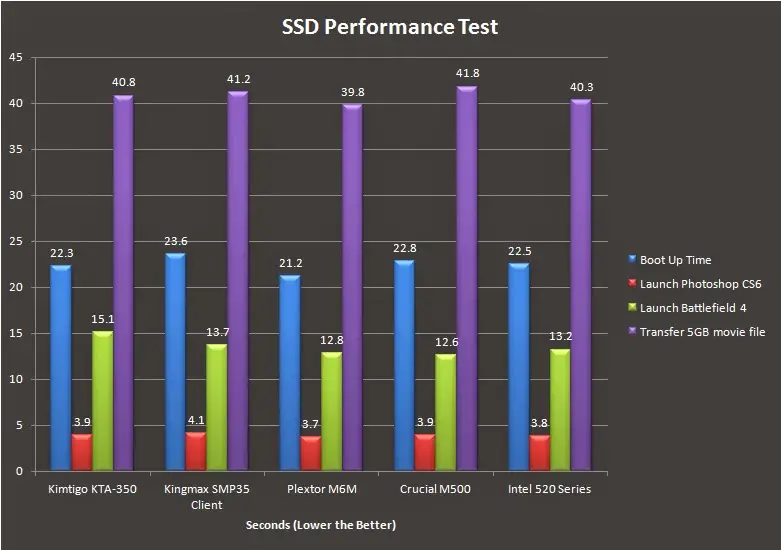
There isn’t much performance gap seen but from the result above, we can see that the Kimtigo KTA-350 is doing pretty well with the boot up time, launching Photoshop CS6 and transfer 5FB movie file. Launching Battlefield 4 doesn’t seems to goes well with the Kimtigo KTA-350 even with few attempts, but rest is assured that there’s no visible performance degradation throughout the test.
Pros
- Comes with a standard 3 year warranty
- Decent performance
- Use of quality components
Cons
- Lower sequential write speed